Dashboard
The Dashboard is your default landing page after sign-in. It is a real-time snapshot of today's activity plus a small set of leading indicators - meant for a 30-second status check, not for deep reporting (use Reporting for that).
Find it under Dashboard in the sidebar, or just hit your CRM root URL.
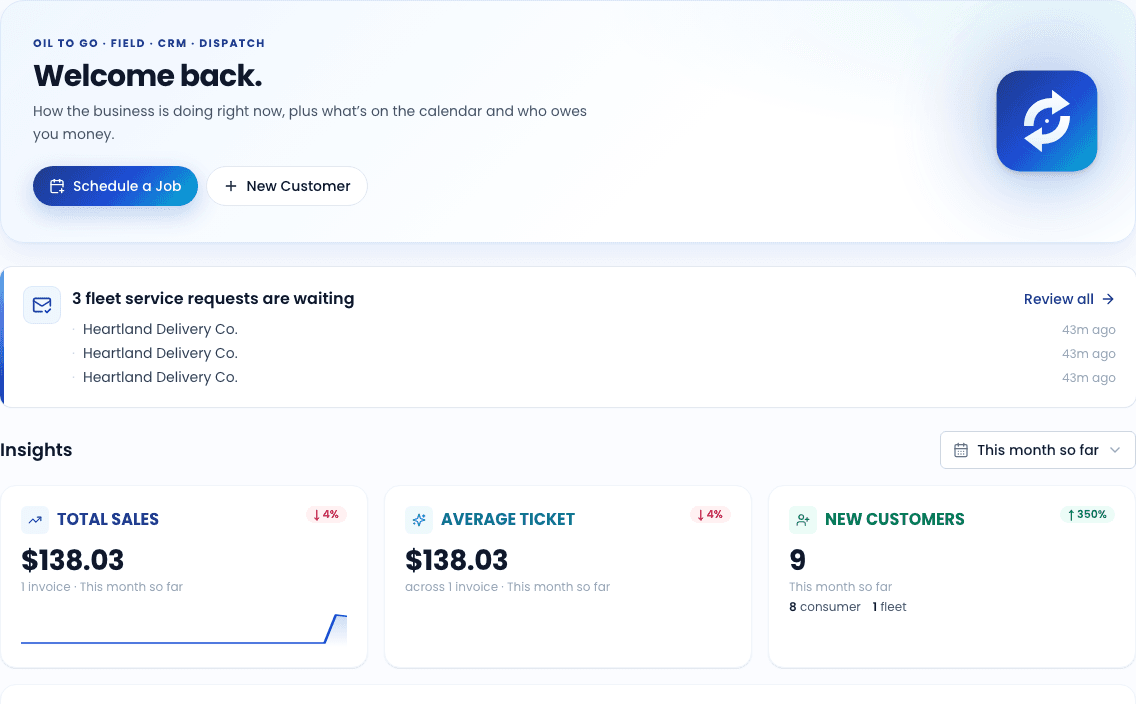
What you see
The dashboard is composed of cards. Roughly in order:
Hero banner. Branded header with shop name, today's date, and primary actions ("New work order", "New customer").
Fleet request banner. When you have pending fleet service requests, a banner up top surfaces the count and links to the Requests inbox. Hidden when the inbox is empty.
KPI cards. A grid of summary stats with their respective deltas vs. the prior period:
| Card | Reads |
|---|---|
| Total sales | Sum of paid invoices over the selected range |
| Today's status | Counts of jobs at each WO status (scheduled / en route / in progress / completed) |
| Upcoming jobs | Next 5 WOs in the schedule, with assigned tech and ETA |
| Open invoices | Count + sum of unpaid invoices, with overdue subtotal |
| Vehicles due | Count of vehicles flagged as due for service in the next 30 days |
| New customers | Count over the selected range |
| Cancellation rate | Canceled WOs / scheduled WOs, over the selected range |
| Average ticket | Mean invoice total over the selected range |
| Daily revenue | Sparkline of paid revenue per day over the selected range |
| Booking funnel | Booking widget impressions / starts / submissions / accepted, with conversion percentages |
| Open booking leads | Bookings that landed in your Booking queue but have not been turned into WOs yet |
| Tech utilization | % of tech-hours booked vs. total available, by tech |
| Open tasks | Count of your open tasks, with the top 5 by due date |
Date range
The dashboard's "selected range" is a chip picker at the top: Today, This week, Last 7 days, This month, Last 30 days, This quarter, Custom. Range is per-user and saved across sessions in localStorage.
Switching the range re-fires the data queries for every range-dependent card; static "today" cards (Upcoming jobs, Today's status) are unaffected.
Permissions
The dashboard renders the same cards for every role, but card data respects role scoping:
- Technicians see only their own assigned WOs and tasks. Total sales, cancellation rate, etc. are hidden.
- Office Manager / Admin / Owner see the full org-scoped view.
When the dashboard is empty
A brand-new account with no WOs, customers, or invoices shows an onboarding card instead of empty KPI cards. The card walks you through the four quick-start steps: add a customer, add a service type, create your first work order, complete it. Each step links into the relevant guide. The card disappears as soon as you have data flowing.
Related
- Getting Started - your first-time tour of the CRM
- Reporting - deeper reports beyond the dashboard
- Triaging fleet requests - what the fleet request banner links to